Debug Kotlin/Wasm code
This tutorial demonstrates how to use IntelliJ IDEA and the browser to debug your Compose Multiplatform application built with Kotlin/Wasm.
Before you start
Debug in IntelliJ IDEA
The Kotlin Multiplatform project you created contains a Compose Multiplatform application powered by Kotlin/Wasm. You can debug this application in IntelliJ IDEA out of the box, without additional configuration.
In IntelliJ IDEA, open the Kotlin file to debug. In this tutorial, we'll work with the
Greeting.ktfile from the following directory of the Kotlin Multiplatform project:WasmDemo/composeApp/src/wasmJsMain/kotlin/wasm.project.demo.wasmdemoClick on the line numbers to set breakpoints on the code that you want to inspect.
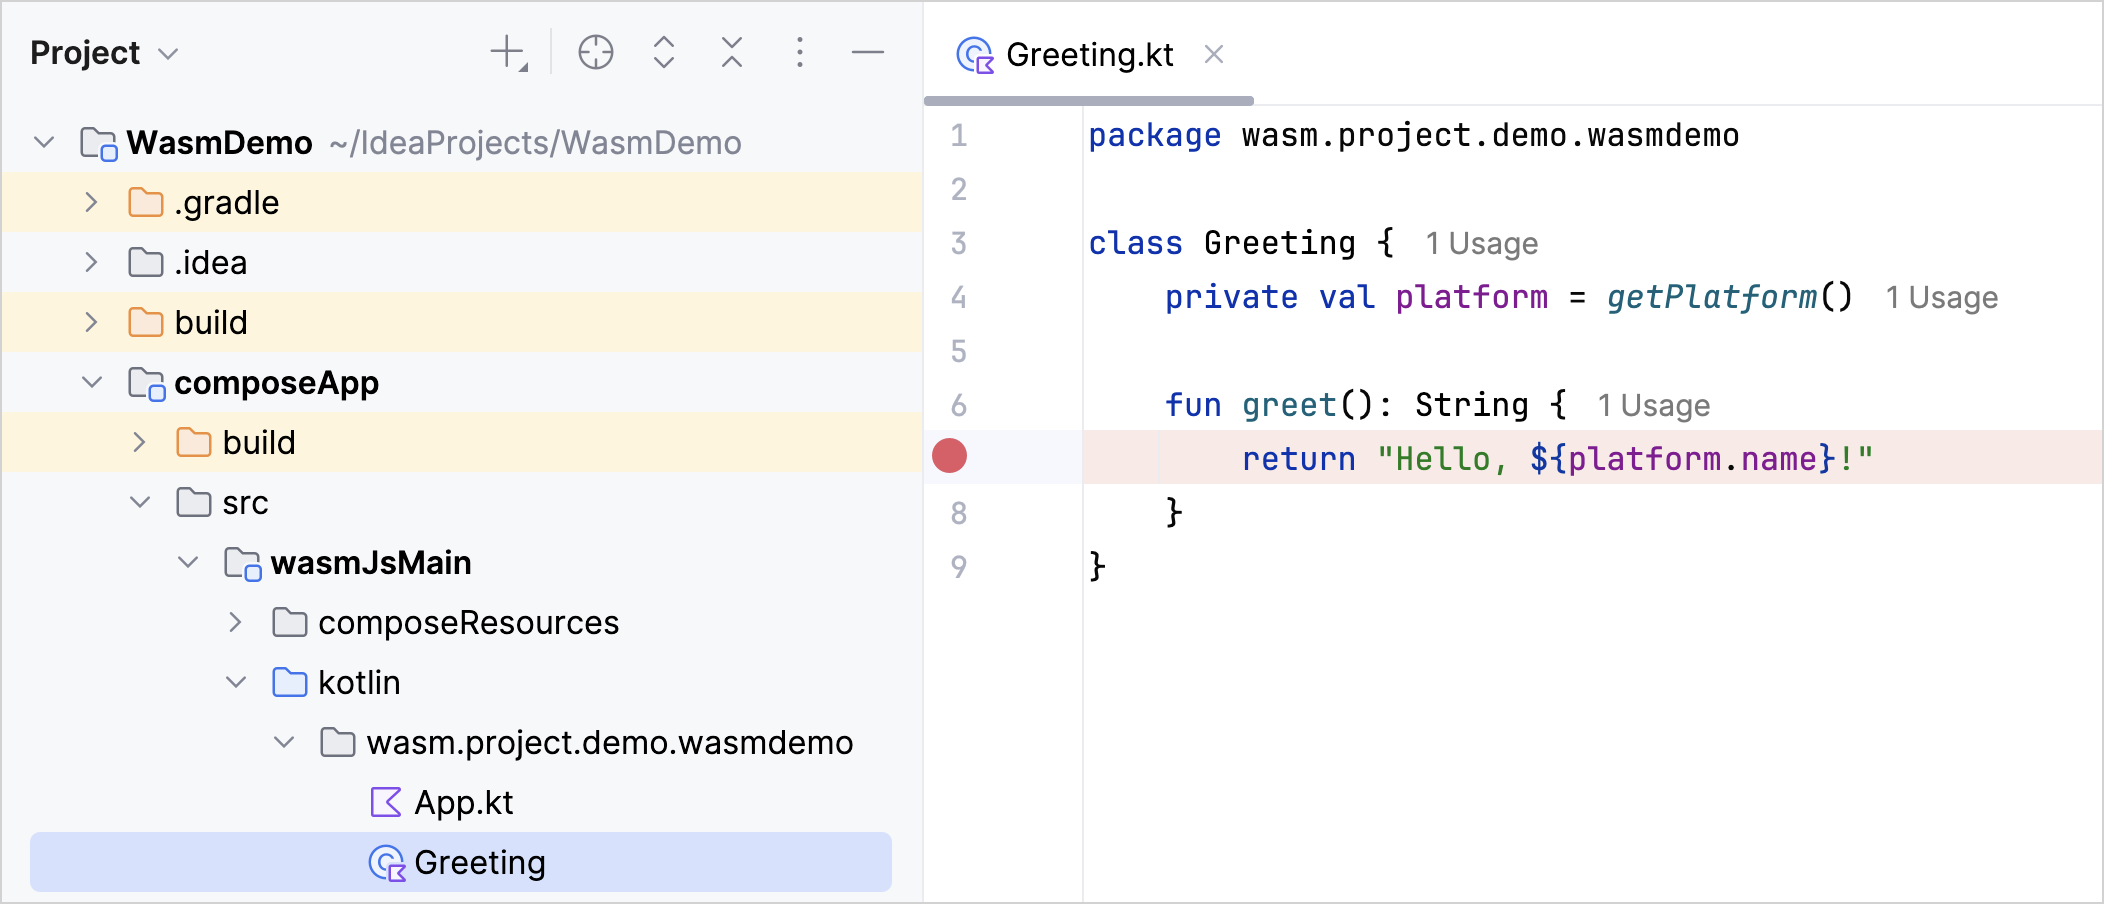
In the list of run configurations, select composeApp[wasmJs].
Run the code in debug mode by clicking the debug icon at the top of the screen.

Once the application starts, it opens in a new browser window.
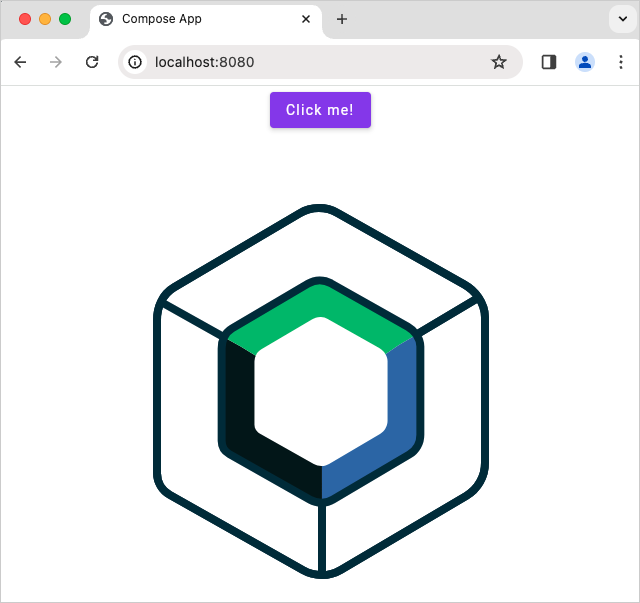
Also, the Debug panel opens automatically in IntelliJ IDEA.

Inspect your application
In the application's browser window, click on the Click me! button to interact with the application. This action triggers the execution of the code, and the debugger pauses when the execution reaches a breakpoint.
In the debugging pane, use the debugging control buttons to inspect variables and code execution at the breakpoints:
 Step over to execute the current line and pause on the next line.
 Step into to investigate a function more deeply.
 Step out to execute the code until it exits the current function.
Check the Threads & Variables pane. It helps you trace the sequence of function calls and pinpoint the location of any errors.
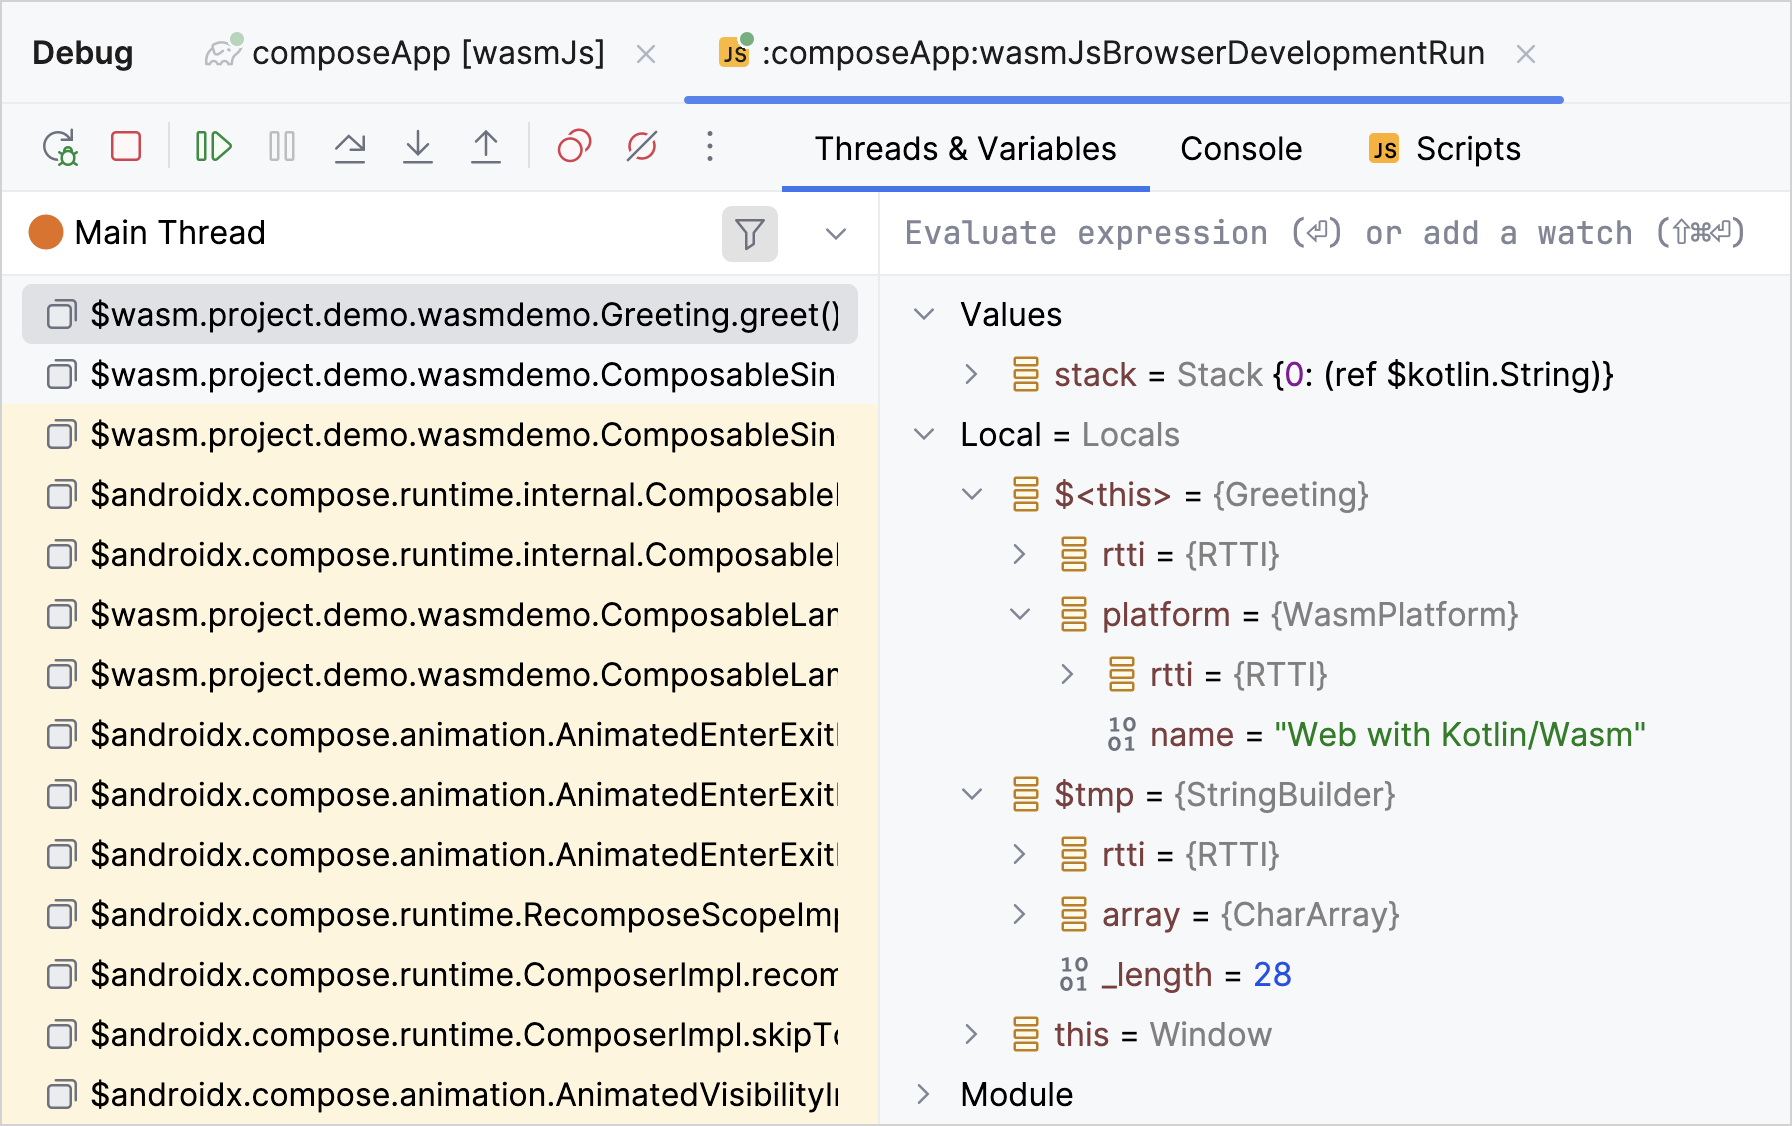
Make changes to your code and run the application again to verify how it works.
When you're done debugging, click on the line numbers with breakpoints to remove the breakpoints.
Debug in your browser
You can also debug this Compose Multiplatform application in your browser without additional configuration.
When you run development Gradle tasks (*DevRun), Kotlin automatically serves the source files to the browser, allowing you to set breakpoints, inspect variables, and step through Kotlin code.
The configuration to serve the Kotlin/Wasm project sources in the browser is now included in the Kotlin Gradle plugin. If you previously added this configuration to your build.gradle.kts file, you should remove it to avoid conflicts.
Follow the instructions to run the Compose Multiplatform application.
In the application's browser window, right-click and select the Inspect action to access developer tools. Alternatively, you can use the F12 shortcut or select View | Developer | Developer Tools.
Switch to the Sources tab and select the Kotlin file to debug. In this tutorial, we'll work with the
Greeting.ktfile.Click on the line numbers to set breakpoints on the code that you want to inspect. Only the lines with darker numbers can have breakpoints — in this example, 4, 7, 8, and 9.
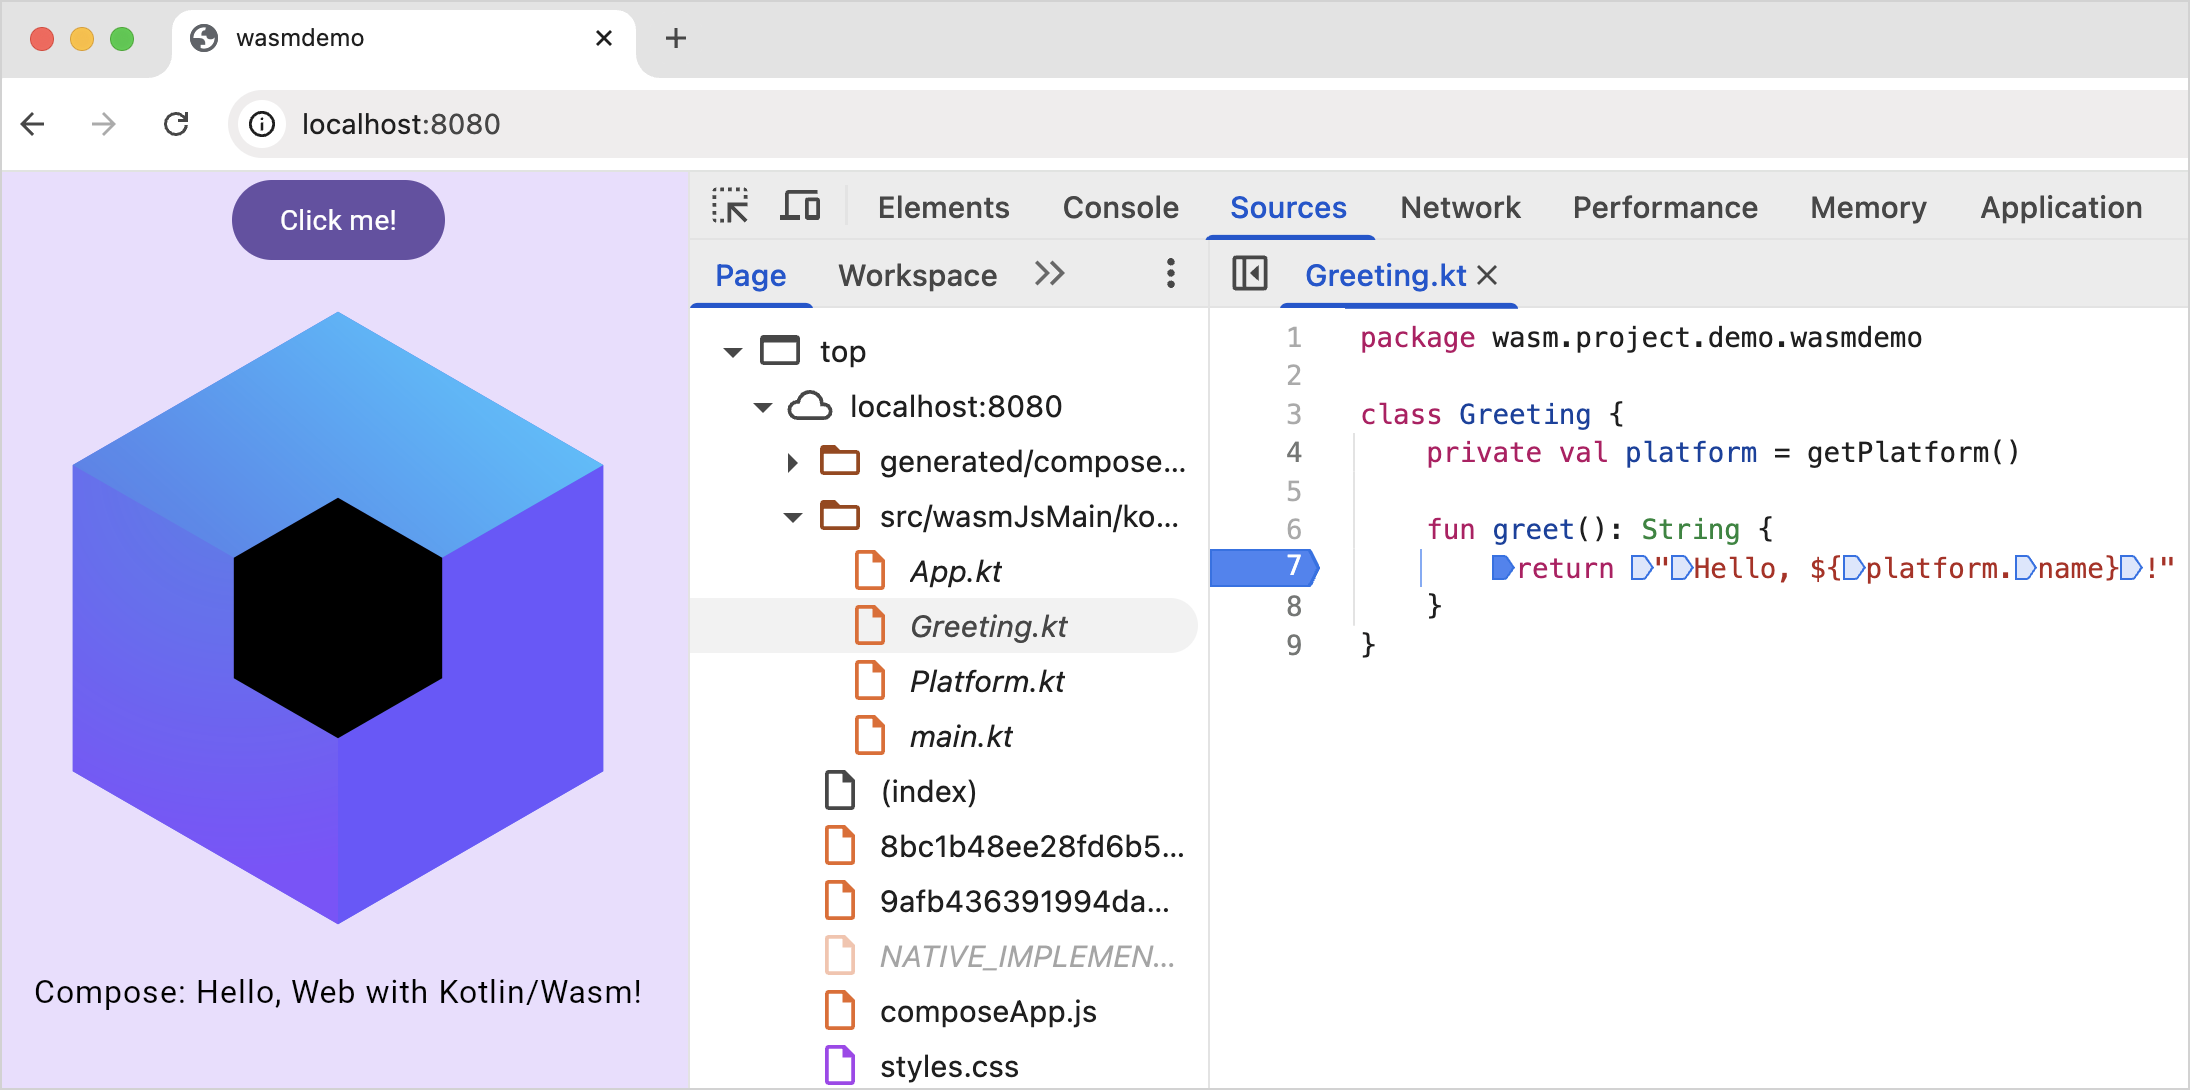
Inspect your application similar to debugging in IntelliJ IDEA.
When debugging in your browser, the panes to trace the sequence of function calls and pinpoint any errors are Scope and Call Stack.
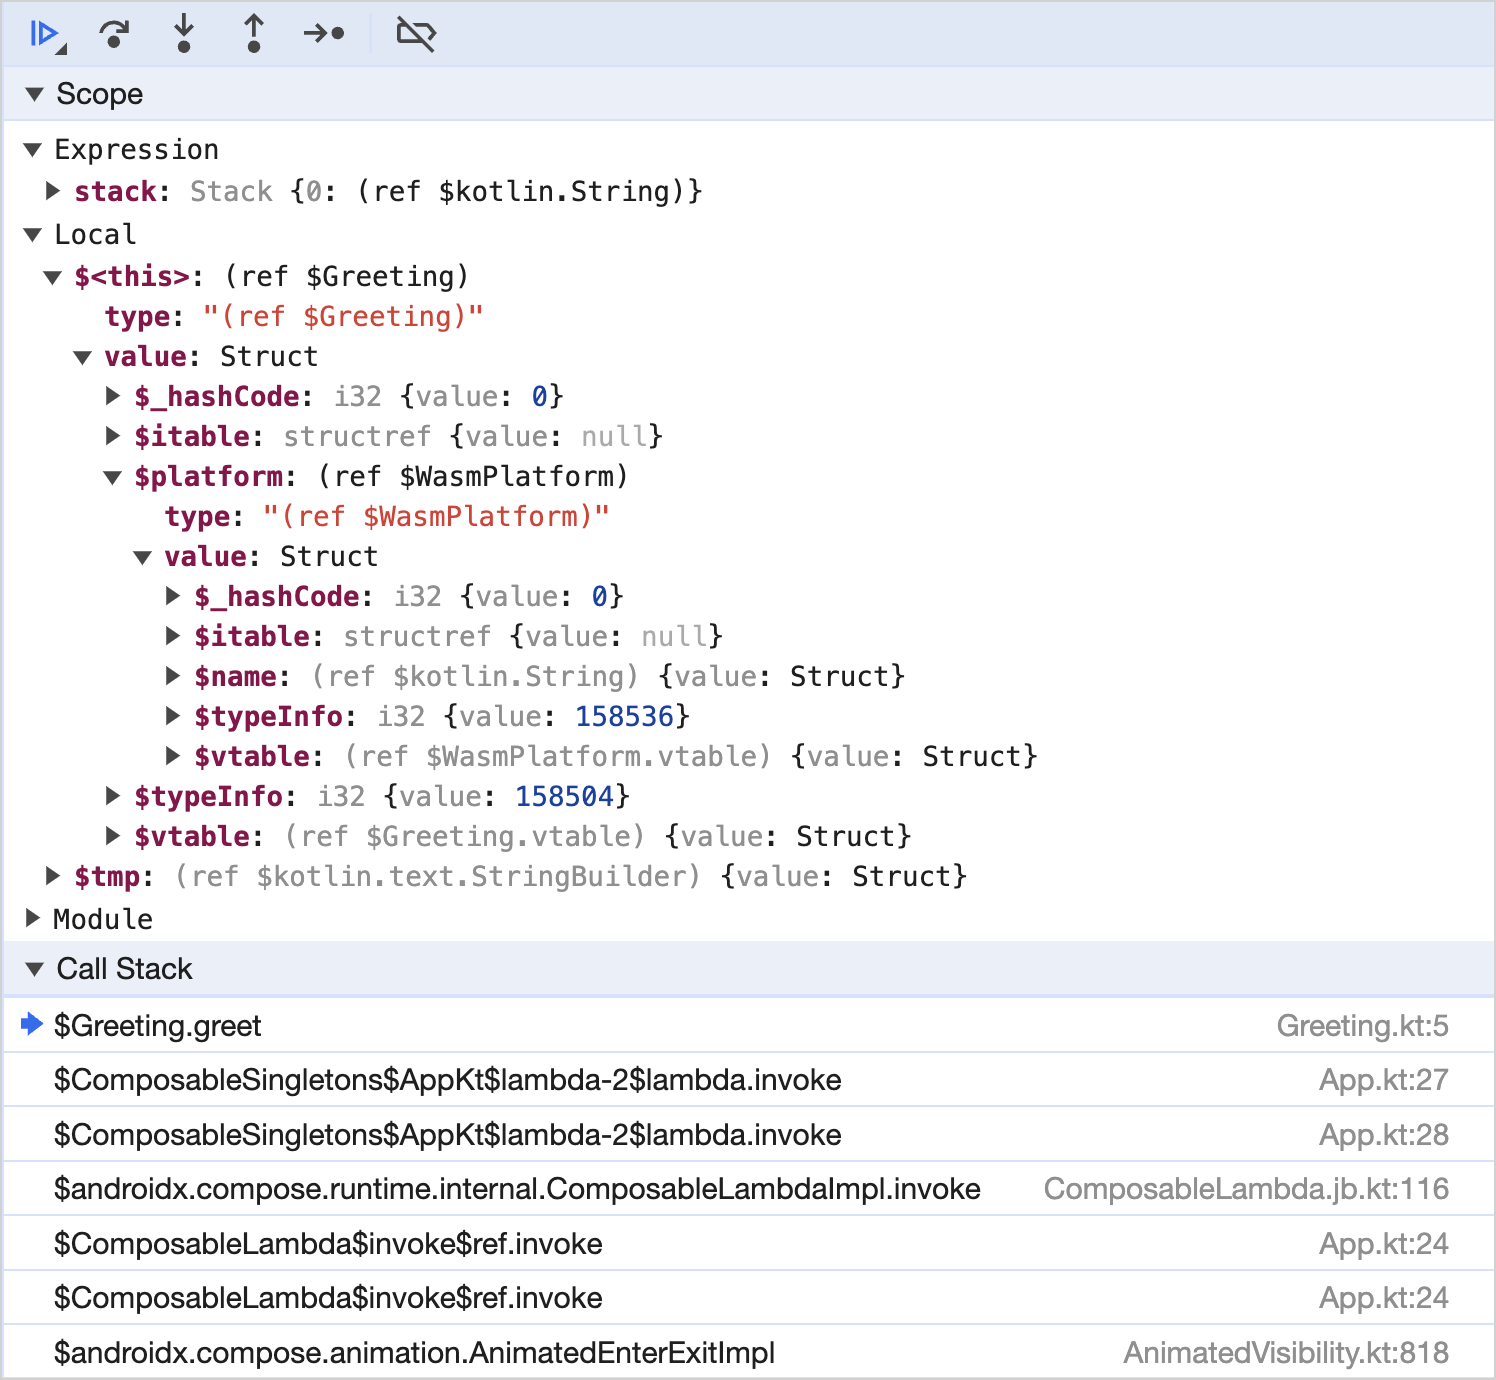
Use custom formatters
Custom formatters help display and locate variable values in a more user-friendly and comprehensible manner when debugging Kotlin/Wasm code in your browser.
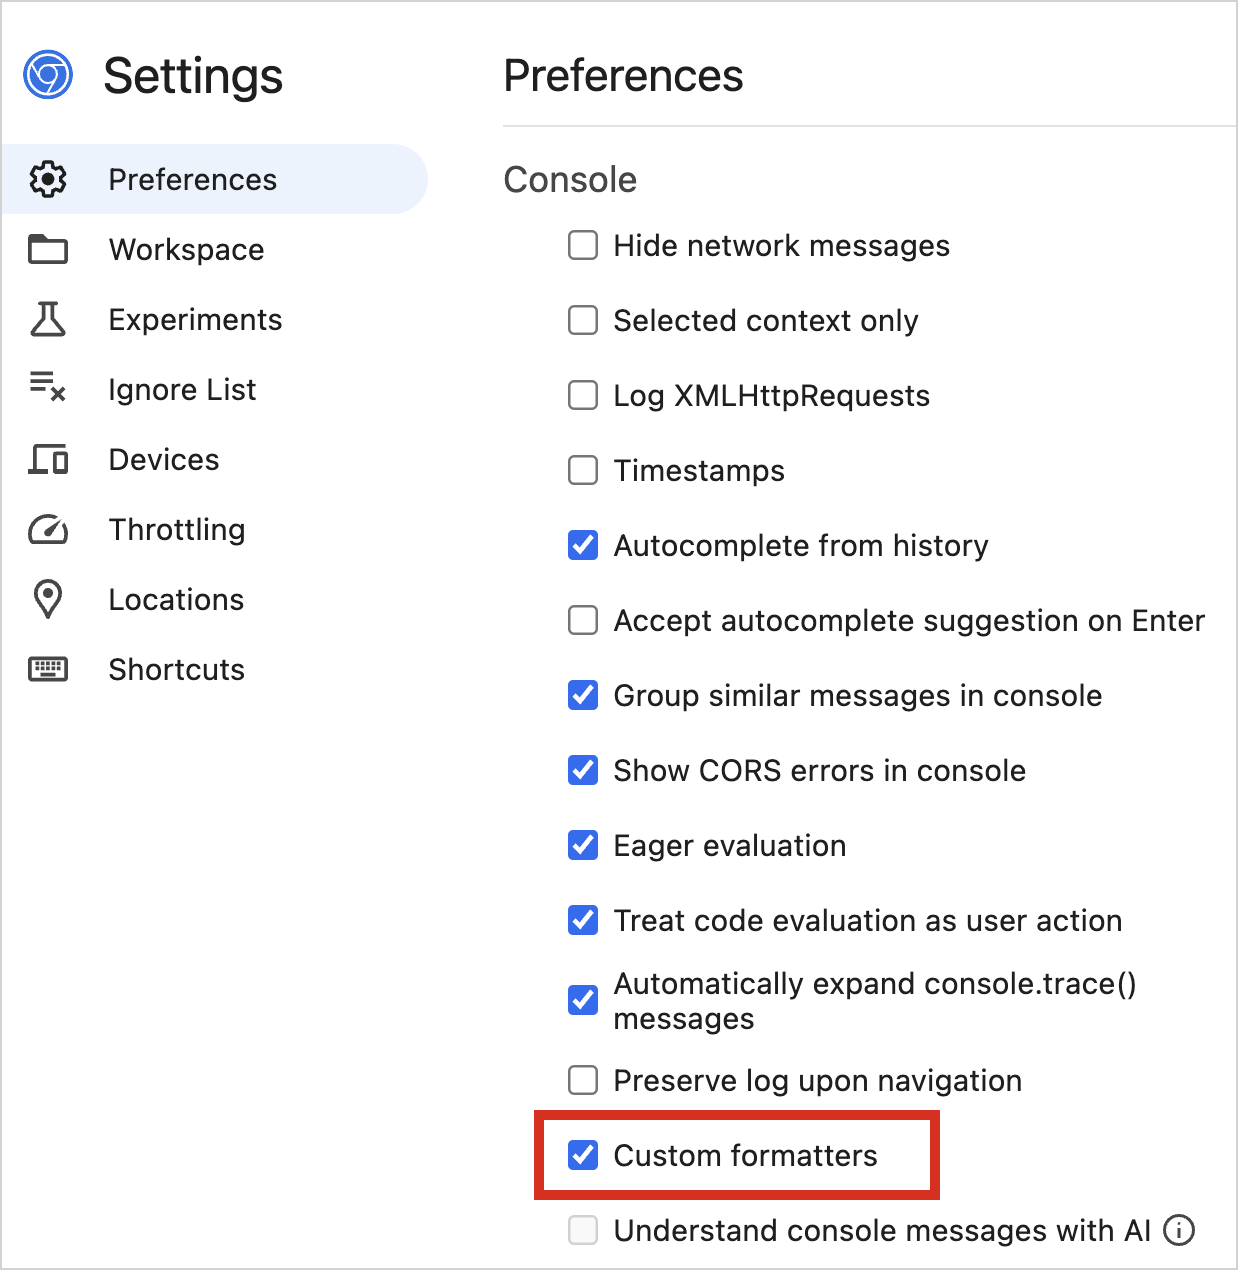
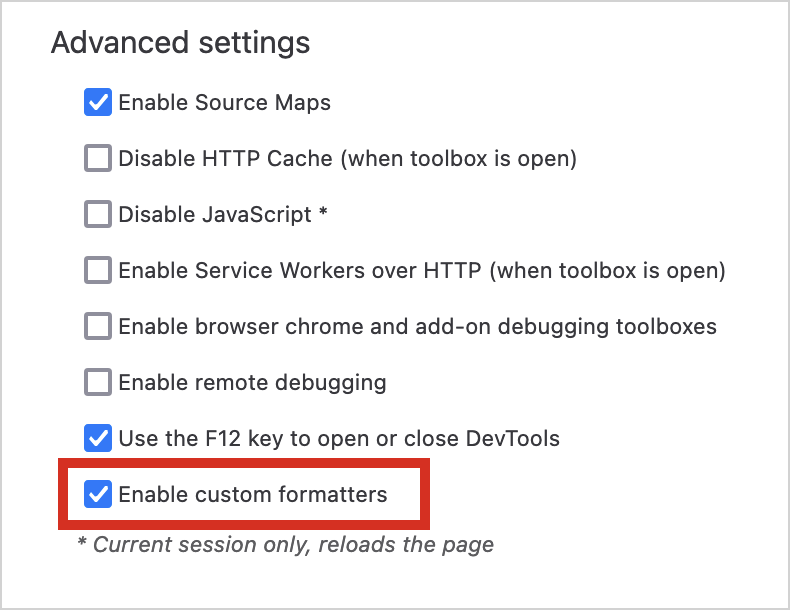
Custom formatters are enabled by default in Kotlin/Wasm development builds, but you still need to ensure that custom formatters are enabled in your browser's developer tools:
In Chrome DevTools, find the Custom formatters checkbox in Settings | Preferences | Console:
In Firefox DevTools, find the Enable custom formatters checkbox in Settings | Advanced settings:
This feature uses the custom formatters API, and is supported in Firefox and Chromium-based browsers.
Given that custom formatters work by default only for Kotlin/Wasm development builds, you need to adjust your Gradle configuration if you want to use them for production builds. Add the following compiler option to the wasmJs {} block:
Leave feedback
We would appreciate any feedback you may have on your debugging experience!
Slack: get a Slack invite and provide your feedback directly to the developers in our #webassembly channel.
Provide your feedback in YouTrack.
What's next?
See Kotlin/Wasm debugging in action in this YouTube video.
Try more Kotlin/Wasm examples: